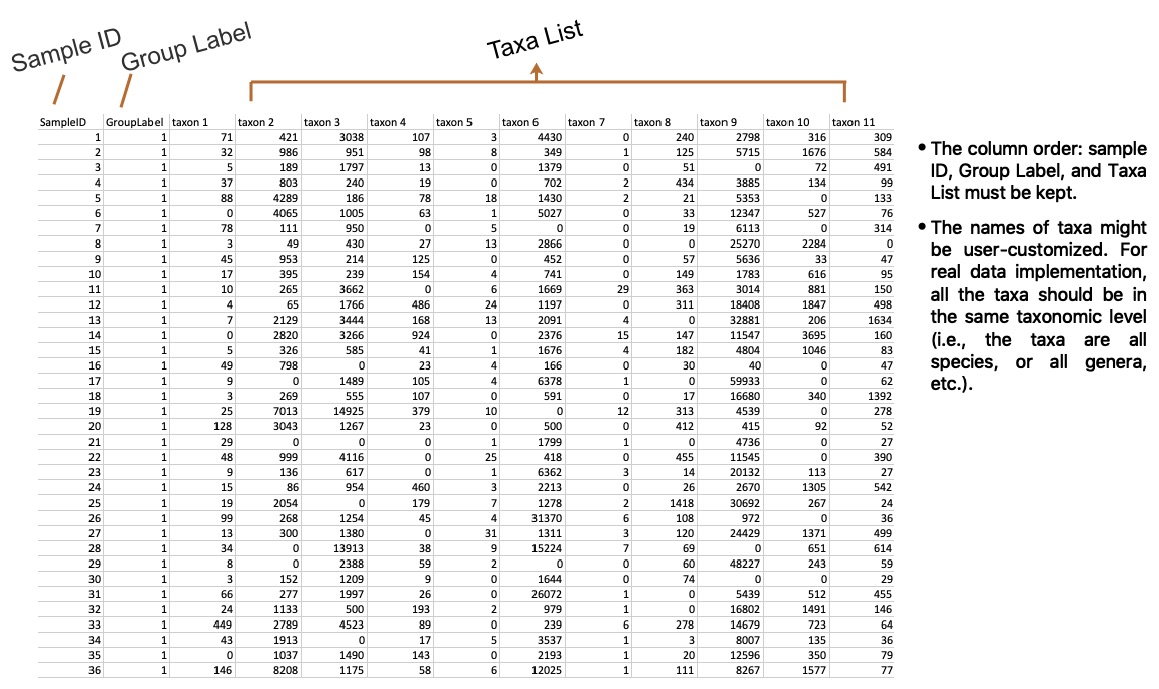
HARMONIES takes the subject-by-taxon count matrix and the subjects’ phenotype as the model input. Please refer to the example of microbiome count information on the right for how to organize the input information into a single .csv file.
HARMONIES can handle either one or two phenotypes among all the subjects. When all the subjects have the same phenotype, HARMONIES provides (1) the estimated partial correlations in the network, and (2) the normalized abundances given by the zero-inflated negative binomial model with the Dirichlet process prior. Given two phenotypes (e.g., subjects with disease and healthy controls), HARMONIES jointly models the observations from the two groups to achieve an improved abundance estimation. It provides (1) the estimated partial correlations in two networks corresponding to the two groups, (2) the normalized abundances of the taxa in each phenotype group, (3) the posterior probability for each taxon to be differentiating between the two groups, and (4) the estimated fold change of each taxon between the two groups.

