Explorer
Data Type
Method Summary
GEO is one of the rank aggregation methods in Borda’s collection, which uses geometric mean of base rankers to aggregate rank data. Here we include five methods: BOOST-GP, BOOST-MI, SPARK, SpatialDE and BinSpect-rank as base rankers for the rank aggregation since these five methods have good performance on the simulation data.
Available in R package “TopKLists” Version: 1.0.7MC2 is a rank aggregation method developed under a Markov chain modeling framework, where the union of items from all base rankers forms the state space. A transition matrix is then constructed in a way such that its stationary distribution will have larger probabilities for states that are ranked higher, specially, the chain will move to a state with better rankings in at least half of the base rankers. Hence, the aggregate ranker is determined by the stationary probability of each state. Here we include five methods: BOOST-GP, BOOST-MI, SPARK, SpatialDE and BinSpect-rank as base rankers for the rank aggregation since these five methods have good performance on the simulation data.
Available in R package “TopKLists” Version: 1.0.7BOOST-GP is a Bayesian hierarchical model to identify spatially variable genes (SVGs). It models gene expression counts with a zero-inflated negative binomial distribution, and identifies those genes whose relative expression levels exhibit spatially correlated patterns through a geostatistical mixture model based on Gaussian process. BOOST-GP uses the squared exponential (SE) and white noise kernels to define the SVG and non-SVGs. It implements Markov chain Monte Carlo (MCMC) algorithms to sample from the posterior distribution and guides the SVG selection via computing the Bayes factor.
Available in R package “BOOST” Version: 0.1.0BOOST-MI is a multi-stage analysis tool to identify spatially variable genes (SVGs) from the spatial molecular profiling (SMP) data whose gene expression levels are measured on a lattice grid. It first normalizes gene expression counts to relative expression levels. Then, it dichotomizes relative expression levels to high and low-expression groups for each gene. Last, it characterizes the resulting gene-specific binary spatial pattern via inferring the Ising model interaction parameter under a Bayesian framework. It applies auxiliary variable Markov chain Monte Carlo algorithms to sample from the posterior distribution with an intractable normalizing constant and guides the SVG selection via computing the Bayes factor.
Available in R package “BOOST” Version: 0.1.0BinSpect is a multi-stage analysis tool to identify spatially variable genes (SVGs), based on statistical enrichment of binarized expression levels in neighboring cells within the spatial network. It first constructs the binary or weighted spatial neighborhood network, where nodes are cells or spots and edges are defined by k-nearest neighbors or radial distance cutoff. Then, for each gene, it dichotomizes expression counts using k-means clustering or top percentage rank thresholding. Last, it builds a contingency by counting the different combinations of binarized expression value pairs between neighboring cells and conducts a Fisher exact test to test their independence. BinSpect outputs p-values for selecting SVGs.
Available in R package “Giotto” Version: 1.0.3MERINGUE is a density-agnostic method to identify spatial gene expression heterogeneity using spatial autocorrelation and cross-correlation analyses. It uses Voronoi tessellation to define cellular neighborhoods. Moran's I is calculated to identify spatially heterogeneous genes, and the scale of significantly spatially heterogeneous genes is characterized based on a local indicator of spatial association (LISA). Further, MERINGUE computes a spatial cross-correlation index (SCI) to group genes into primary spatial patterns.
Available in R package “MERINGUE” Version: 1.0SOMDE is a machine learning-based method to identify spatially variable genes (SVGs) in large-scale spatial expression data. It builds upon Self-Organizing Map (SOM), an unsupervised neural network for dimensionality reduction while preserving the topological structure of the data, to merge spatially neighboring data into different nodes. SVGs are then identified based on the node-level spatial location and converted gene meta-expression profiles using a modified Gaussian process with Gaussian, linear or periodic kernels. Available in Python package “somde” Version: 0.1.8
SPARK uses a hierarchical geostatistical modeling framework with a Gaussian process to identify spatially variable genes (SVGs). It directly models the gene expression counts with a Poisson linear mixed model. The Gaussian process covariance is composed of spatial effect and random noise. Ten spatial kernels, including five Gaussian and five periodic kernels with different length-scale characteristics, are employed to accommodate various spatial patterns. For each setting, SPARK tests if the spatial effect equals zero via the penalized quasi-likelihood algorithm. It utilizes the Cauchy combination rule to produce a well-calibrated p-value to indicate whether the test gene is an SV gene.
Available in R package “SPARK” Version: 1.1.2SPARK-X (SPARK-eXpedited) is a scalable non-parametric model for spatial expression analysis. It builds on a robust covariance test framework and incorporates various spatial kernels to model sparse count data from large studies, and thus enables rapid and effective spatially variable gene (SVG) detection with statistical robustness and enhanced power. Compared with SPARK, SPARK-X reduces computational complexity and space usage, leading to significant improvements in speed and memory efficiency.
Available in R package “SPARK” Version: 1.1.2Seurat is a R package for analyzing and visualizing single-cell RNA sequencing (scRNA-seq) and sequencing and imaging-based spatially resolved data. It provides statistical methods to integrate data from multiple sources and perform flexible data analysis and visualization. For spatial transcriptomics data analysis, it equips with a tool for spatially variable gene (SVG) detection by calculating Moran’s I, a statistical measure used to assess spatial autocorrelation in geographical data. Associated p-value is provided to measure the significance of the observed spatial pattern.
Available in R package “Seurat” Version: 5.1.0SpaGCN is a spatial domain and spatially variable gene (SVG) identification approach based on the graph convolutional network for spatially resolved transcriptomics data. Unlike other SVGs detection methods, it takes spatial domains into consideration and aims at distinguishing regional SVGs. First, SpaGCN integrates the information from gene expression profile, location and pathology image to identify spatial domains via graph convolution. Then, domain guided differential expression analysis for each gene is conducted. SVGs are defined by having a large expression fold change between the target and neighboring domains.
Available in Python package “SpaGCN” Version: 1.2.0SpatialDE uses a geostatistical modeling framework with a Gaussian process to identify spatially variable genes (SVGs). It can only apply to normalized expression levels (e.g. converted from gene expression counts via variance stabilizing transformation). The Gaussian process covariance in the linear mixed model is composed of spatial effect and random noise. The spatial kernels include squared exponential, periodic, and linear. The fraction of variance attribute to spatial effects is determined by gradient-based optimization. Based on the asymptotic chi-square test, SpatialDE outputs p-values to indicate if the test gene is an SVG.
Available in R package “spatialDE” Version: 1.1.3Trendsceek is a nonparametric method without distribution specification which models data as marked point process. Points represents spatial locations of cells or spots, marks of each point represent expression levels. SVGs are identified by mark-segregation hypothesis testing since for the distribution of all pairs at a particular radius, a mark segregation is said to be present if the distribution is dependent on r such that it deviates from what would be expected if the marks were randomly distributed over the spatial locations of the points. The testing is carried out with permutation tests to randomize expression level and keeping cells location fixed. Four summary statistics are reported: conditional mean (E-mark), conditional variance (V-mark), Stoyan’s mark correlation and the mark-variogram.
Available in R package “trendsceek” Version: 1.0.0nnSVG is a scalable approach to identify spatially variable genes (SVGs) based on nearest-neighbor Gaussian processes (NNGP) model. It uses squared exponential covariance function to model the spatial patterns and estimates a gene-specific length scale parameter within the spatial covariance function in Gaussian Processes (GPs). The recent statistical advancements in computationally scalable parameter estimation enables low computational complexity for GPs model fitting.
Available in R package “nnSVG” Version: 1.8.0
Dataset
We provide 600+ Simulated Datasets and 193+ Real Datasets. The simulation datasets include 5 spatial patterns and 4 sparsity settings. The real datasets include 16 tissue origins from humans or mice. All datasets are downloadable.
Method
We collected 12 existing spatial gene analysis methods. For all methods, the default setting is applied, and the software version is recorded. All methods are applied to simulated datasets. Thus, the model performance metrics are calculated and summarized in the interactive bar plots.


Analysis
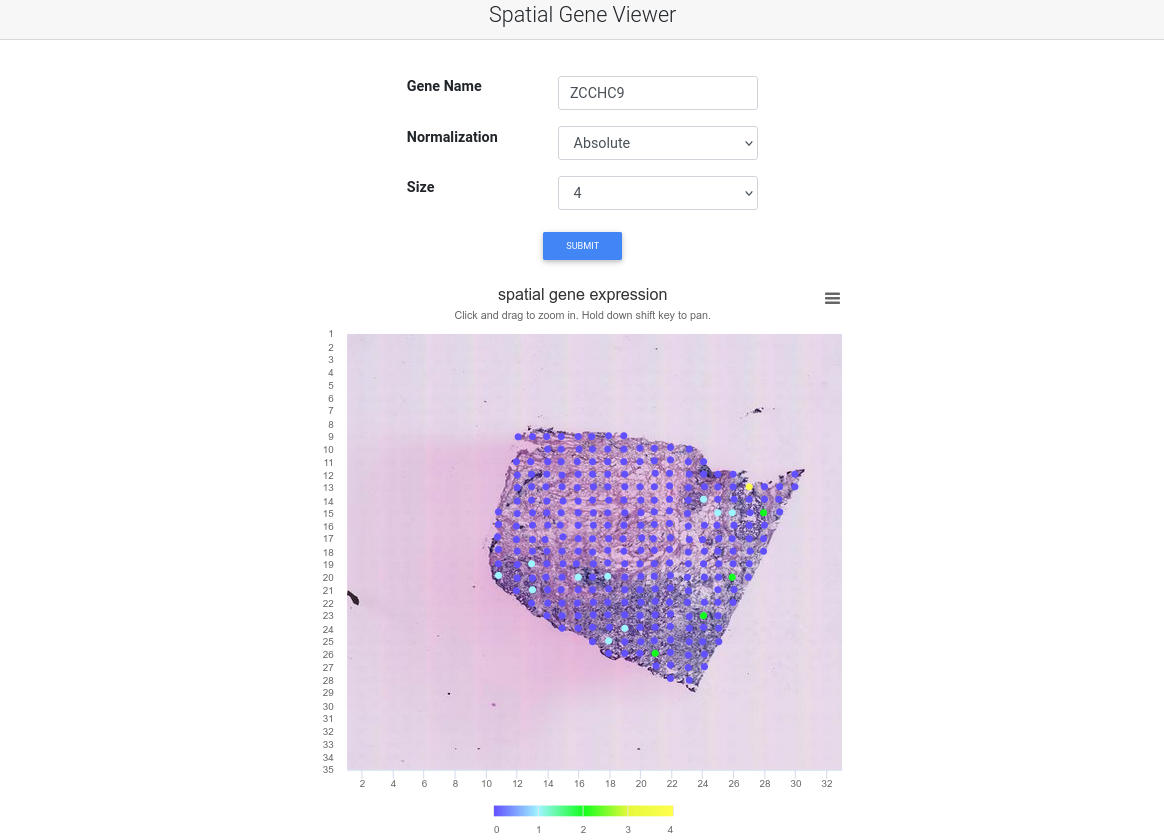
We analyze all combinations of datasets and methods. For each gene, we list the reported p-values by each method. Users can sort and rank by the statistical significance for each method. These results can be reproduced as datasets and methods are documented and accessible in the dataset tab and method tab. Users can also use the accompanied spatial gene viewer to examine the spatial gene expression pattern interactively.